Regression
According to Wikipedia definition of Regression
' regression analysis is a set of statistical processes for estimating the relationships among variables. It includes many techniques for modeling and analyzing several variables, when the focus is on the relationship between a dependent variable and one or more independent variables'
-😏'I was suppose to learn AI in simpler way'
Hold on we moving toward learning AI only. Starting with the high school mathematics lets recall 'Sets and Function'
A function is a relation between a set of inputs and a set of permissible outputs with the property that each input is related to exactly one output
Yes you guessed it right, Mathematically the above function is
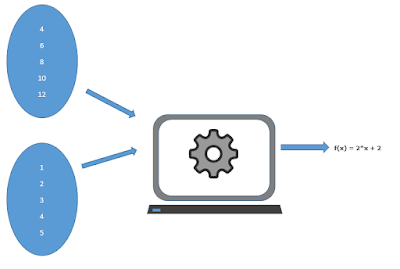
😓 QUIZ :- Can you find a relation between these two sets of data with your human intelligence?
Y= f(x) = 2*x + 2
So in a world of Artificial Intelligence this mapping for the set of numbers or finding a semantic relation between numbers in form of a mathematical function is called Regression.
-😏'But How can I make my Computer learn this function'
We will give both sets of data to our Computer Code that will find the suitable function for it
Plotting the X and Y values gives us the interpretation that it is a Linear Regression. So we can start off our Computer Code with a General Equation of line i.e:-
Y= f(x) = m*x + c
and assume any random value for slope m and intercept c. Let it be m=0 and c=1, Now
Y= f(x) = 0*x + 1;
Y= f(x) = 1;
Y= f(x) = 0*x + 1;
Y= f(x) = 1;
But the expected output Y is [4,6,8,10,12...] and we are getting only Y=1 for every input value of X.
-😐'This is such a huge error'
Okay lets assume m=0.5 and c=1, BUT WAIT you are doing hit and trial, then where is Intelligence involved in it😕
Okay the next task of our Computer code is to minimize the error using a systematic approach ratter than Hit and Trial every combination.
Where n is the total number of samples
The differentiation of this Mean Square error with respect to variable m and c gives us the error rate as well as the direction of the adjustment of our m and c values, this is called Gradient Decent in world of Artificial Intelligence.
Note: Differentiation can be done using already existing libraries
So the value of m and c can be updated as
The Error will slowly converge to minimum using above process repeatedly. Now the new line is almost fitting our graph and now we can say that our AI model has approximated the function well and we can predict any value.
Y= f(x) = 2*x + 2 ≈ 1.75*x + 1.98 🙂


nice
ReplyDelete